Calculate Your Impact
Move the slider to see what your contribution delivers through our shared gravity filters in DR Congo: about $80 per filter, all-in, serving about 25 people for about 5 years. Lives saved is an estimate (about $1,000 per life); see how we estimate it.
Gallons of Safe Water (5 years)
57,031
People Served
31
Shared Filters
1.3
Estimated Lives Saved
0.10
What Each Tier Delivers
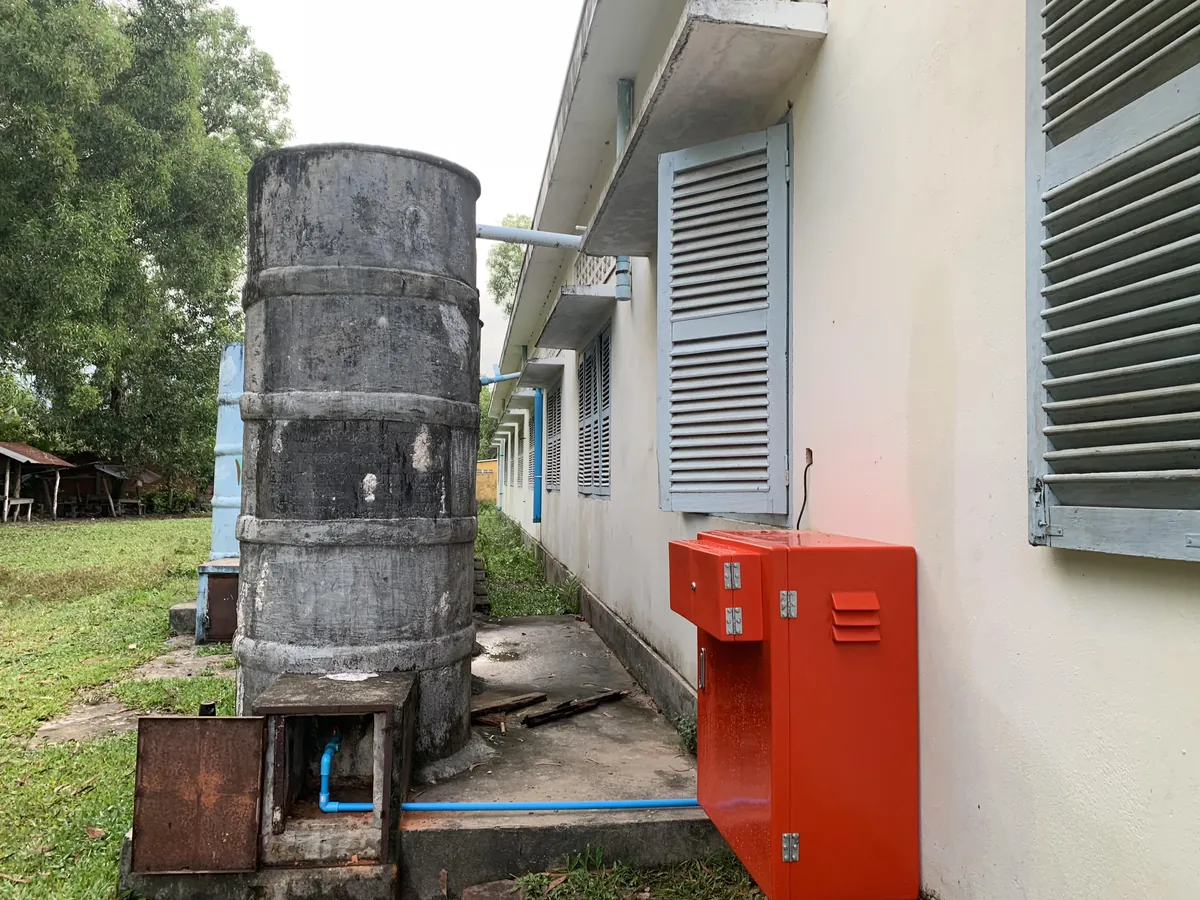
Ultrafiltration-treated drinking water at a rural Cambodian school, covering three children for more than 5 years.
A complete gravity membrane filter delivered to five families (about 25 people) in DR Congo. The price covers the $50 filter plus buckets, parts, shipping, and our partner PALPER’s build and training.
A turnkey rainwater + ultrafiltration system serving 200+ students at a rural Cambodian school, installed and maintained by our local partners.
Why Clean Water Is One of the Best Values in Giving
Clean water is among the most cost-effective interventions in global health. Below is how it compares with other categories of philanthropic giving, and why the math works the way it does.
Every $1 invested in clean drinking water yields between $4 and $28 in averted healthcare costs and increased productivity (WHO/UNICEF, GBD analyses).
Return on Each $1 of Philanthropic Investment
Sources: WHO/UNICEF, Copenhagen Consensus, GiveWell. Clean water's wide range reflects the diversity of interventions: chlorination yields multiples that ultrafiltration installations cannot.
Why the Math Works This Way
- The benefits of clean water last for decades. A single $80 gravity membrane filter, delivered, serves five households (about 25 people) for years. The benefits (averted illness, productive school days, reduced healthcare spending) accrue every day for the lifetime of the system.
- Disease prevention dominates disease treatment. Treating cholera, typhoid, or rotavirus in a clinic costs orders of magnitude more than preventing it with a filter. Every dollar of prevention is many dollars not spent on treatment.
- Costs fall with scale. Community-scale ultrafiltration at a school or clinic delivers safe water at $0.50 to $1.50 per person per year, a cost few interventions can match.
- Targeting determines impact. The same filter delivers very different impact in a community with 50% diarrheal disease prevalence versus 5%. We deploy where the return is highest.
For full cost data and methodology, see Technoeconomic Analysis below.
An Enduring Public Health Catastrophe
The global drinking-water crisis is preventable, and unsafe water, sanitation and hygiene cause about one death every twenty-three seconds. 2.2 billion people lack safely managed drinking water, defined as a source that is accessible, available when needed, and free from contamination.
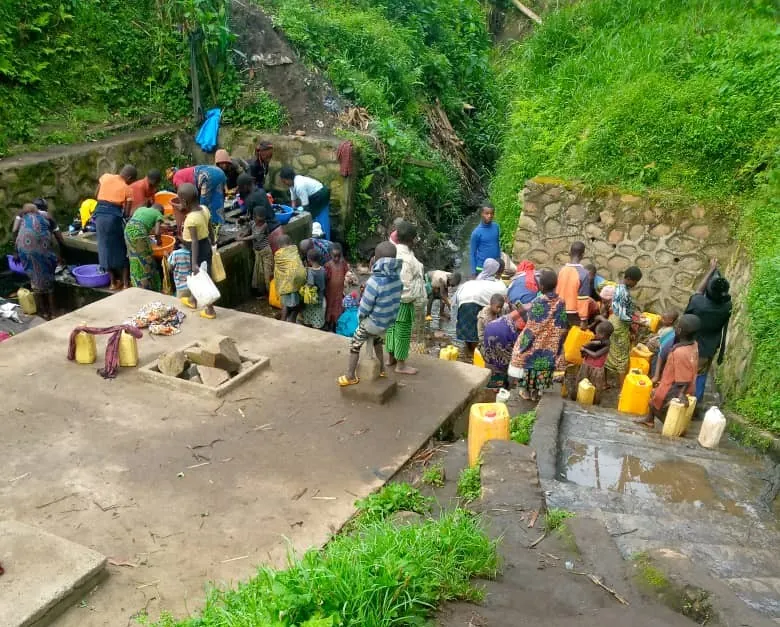
Waterborne disease is a leading cause of death in children under five. Unsafe water, sanitation and hygiene cause roughly 1.4 million deaths a year, including about 395,000 children under five (WHO, 2019). The burden falls disproportionately on Sub-Saharan Africa and South Asia, which together account for more than 80% of waterborne disease deaths in children.
The Pathogens, By Size
Waterborne disease agents fall into three categories. Each requires a different removal or inactivation strategy:
- Protozoa (5–15 µm): Giardia, Cryptosporidium. The largest pathogens, easiest to remove with most physical filters.
- Bacteria (1–5 µm): E. coli, Vibrio cholerae, Salmonella typhi. Removed by fine filtration; inactivated by chemical or UV disinfection.
- Viruses (0.02–0.3 µm): Rotavirus, Norovirus, Hepatitis A. The smallest pathogens, requiring ultrafiltration, chlorination, or UV.
The Daily Toll
Annual Deaths
From diarrheal disease alone (cholera, typhoid, dysentery)
Chronic Infections
People with parasitic infections like schistosomiasis
School Days Lost
Annually, to water-related illness
The Economic Toll
Beyond the human tragedy, waterborne disease drains an estimated $260 billion globally each year through lost productivity, medical costs, and reduced economic potential. Some nations lose up to 6.4% of GDP to poor water and sanitation outcomes. A collective 250 million hours every day are spent walking to fetch water, disproportionately by women and girls.
Diagnose. Design. Deploy.
We don't sell technology. We solve specific water problems for specific communities, using the cheapest and most durable intervention that actually fits the chemistry, the infrastructure, and the people on the ground.
1. Diagnose the Chemistry
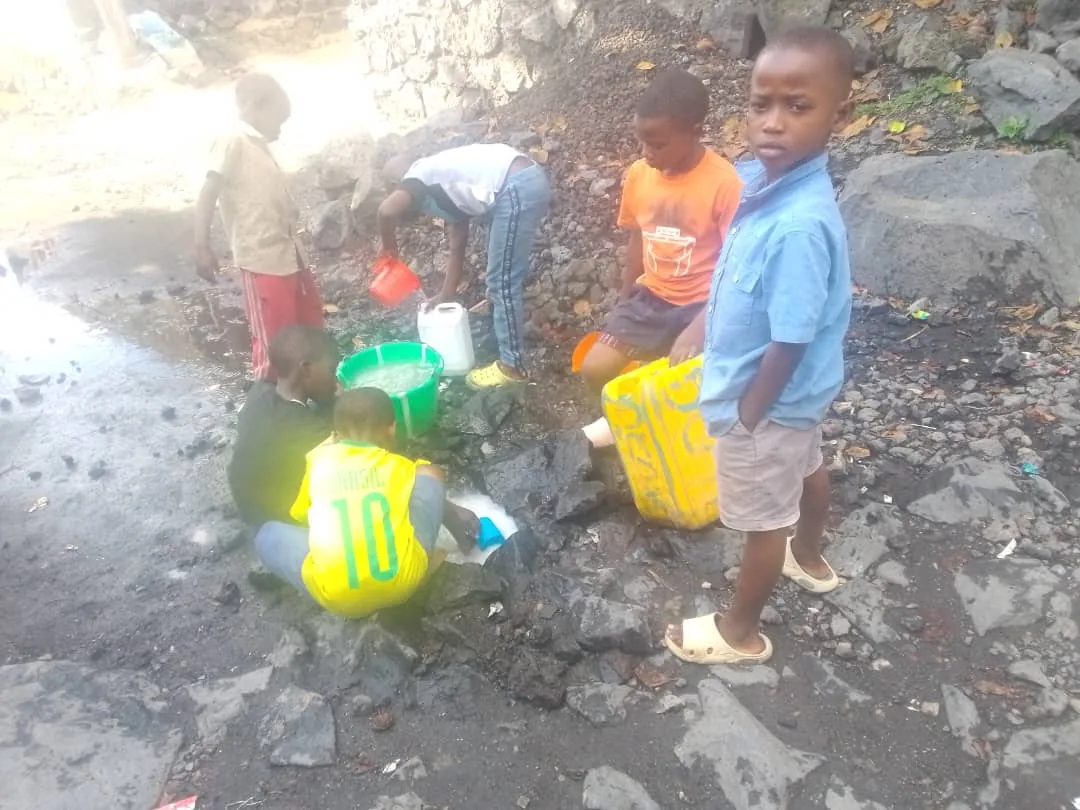
Every project begins with field measurements: pathogen indicators (E. coli most commonly), turbidity, pH, contamination context, and seasonal patterns. We characterize the source (surface water, groundwater, rainfall capture, mixed) and the disease pattern. Without this baseline, technology selection is a guess.
2. Design the Right Solution
Technology selection is a decision, not a default. A community of 50 households on a turbid river needs a different solution than a school sitting on a high-yield clean borehole. We weigh five factors:
- Pathogen profile: what the water actually carries
- Source characteristics: turbidity, flow, seasonal variability
- Infrastructure: power availability, supply-chain access for consumables
- Operational capacity: who maintains the system, with what training, on what budget
- Cultural fit: what the community will actually use, every day, for years
3. Hand It Off and Stay Connected
We work through local partners. Local NGOs and community leaders usually deploy and maintain the systems, and we provide design, training, ongoing remote technical support and, where needed, implementation support. In Mariveles, Philippines, we installed the system ourselves with local volunteers. This is what makes solutions last: community ownership, with expert support behind it.
Many failed water projects are donated systems that didn't match the chemistry, didn't fit the infrastructure, or weren't maintainable by the people who inherited them. We exist because that pattern is fixable.
Treatment Technologies
A range of proven technologies exists to combat waterborne disease. Each has trade-offs across cost, complexity, and pathogen coverage. The right answer is always context-specific.
Disinfection: Inactivating the Pathogens
Boiling
Mechanism: Thermal energy denatures proteins and kills nearly all waterborne pathogens. A rolling boil for one minute is sufficient at most elevations.
Trade-offs: Universally understood and effective, but unsustainable long-term. High fuel demand contributes to deforestation and indoor air pollution. Best reserved for emergencies.
Chlorination
Mechanism: Sodium hypochlorite damages cell membranes and disrupts enzymatic function. Highly effective against bacteria and viruses; less effective against Cryptosporidium.
Trade-offs: Cheap and scalable, but requires a reliable supply chain and accurate dosing. Less effective in turbid water where suspended particles shield pathogens.
UV Disinfection
Mechanism: 254 nm UV light damages microbial DNA, preventing reproduction. Effective against bacteria, viruses, and protozoa.
Trade-offs: No chemical residual, no taste impact, but requires electricity and lamp replacement. Best where reliable power exists.
Filtration: Physically Removing the Pathogens
Ceramic Filters
Mechanism: Sub-micron ceramic pores physically block bacteria and protozoa. Often impregnated with colloidal silver for residual bacteriostatic effect.
Trade-offs: Can be locally produced. Slow flow rate and physical fragility are drawbacks. Does not remove viruses.
Biosand Filters
Mechanism: Layered sand and gravel with a biologically active layer (the "schmutzdecke") that consumes organic contaminants and pathogens.
Trade-offs: Long lifespan (10+ years, often decades), no recurring consumables. Requires careful initial setup and a "ripening" period before reaching full efficacy.
Gravity Membrane Filters
Mechanism: Hollow-fiber ultrafiltration membranes (typically 0.1–0.02 µm pore size) with gravity as the driving pressure.
Trade-offs: Long lifespan, no power needed, very high pathogen removal. Higher upfront cost. Effective on bacteria and protozoa; removes viruses only with a membrane validated at about 0.01 µm.
Solar-Powered Ultrafiltration
Mechanism: Pressurized membrane filtration. A membrane with pores of about 0.01 µm, validated by independent testing, can physically block viruses; a 0.1 µm membrane cannot be relied on to. Solar PV provides the pressure source.
Trade-offs: Highest pathogen protection of any field-deployable technology. Higher capital cost; requires skilled installation and periodic maintenance. Best for community hubs (schools, clinics) serving 100+ people.
Technoeconomic Analysis
Full cost data, decision logic, and methodology behind our technology selections. This is the section to read if you are evaluating us as a technical partner, comparing interventions for a grant program, or trying to understand exactly how the cost-effectiveness numbers in the Calculate Your Impact section are derived.
Cost Comparison: Capital and Annual Per-Person Costs
| Technology | Scale | Capital Cost | Lifespan | Annual $/Person | Key Trade-offs |
|---|---|---|---|---|---|
| Boiling | Household | $0 | N/A | $75 – $175+ | Kills nearly all pathogens; fuel cost prohibitive |
| Chlorination | Household | $0 – $20 | Ongoing | $3 – $6 | Cheap and effective; supply chain risk |
| Ceramic filter | Household | $15 – $50 | 2–5 years | $3 – $25 | Local production; fragile, no virus removal |
| Gravity membrane | Household | $25 – $95 | 10+ years | $0.11 – $1.46 | Long life, no power; limited virus removal |
| Biosand filter | Household | $60 – $150 | 10+ years | $0.26 – $4.02 | Zero recurring cost; setup intensive |
| Solar UF | Community | $400 – $10,000+ | 5–15 years | $1 – $18 | Bacteria and protozoa; viruses only with a validated ~0.01 µm membrane; capital intensive |
Annual costs assume ~3.8 L per person per day. Actual costs vary significantly by region, supply chain, and local labor. Lifespans are general ranges; our DR Congo figures plan on about 5 years for each shared gravity filter.
Decision Logic: Matching Technology to Context
| Technology | Optimal Situation | Key Rationale |
|---|---|---|
| Solar Ultrafiltration | Schools, clinics, water kiosks with sun + skilled maintenance access | Highest protection level; economies of scale at 100+ users |
| Gravity Membrane | Households seeking durable, no-power solution | Excellent balance of cost, simplicity and service life |
| Biosand Filter | Settled households with construction support available | Zero recurring cost; 10+ year lifespan; generational investment |
| Chlorination + Charcoal | Communities with reliable bleach supply chain | Extremely low cost; builds transferable skills |
| Ceramic Filter | Areas with local ceramic-production capacity | Supports local economy; moderate efficacy |
The Science of Selection
Match the Filter to the Pathogen Profile
Pathogen size sets the floor for filter pore size. Viruses (0.02–0.3 µm) are the strictest constraint: anything larger than 0.02 µm pore size will pass viruses. Most ceramic and biosand filters target the bacteria/protozoa range and rely on chemical disinfection or natural die-off for virus management. A hollow-fiber membrane validated at about 0.01 µm can remove viruses, at higher cost.
Disinfection vs. Filtration, or Both
Disinfection (chlorine, UV, boiling) inactivates pathogens but leaves them physically present. Filtration removes them. Disinfection alone struggles with turbid water; filtration alone struggles with viruses. The most resilient systems combine both: filter first to reduce turbidity and load, then disinfect to provide a residual safety margin.
Power and Supply Chain Realities
More well-intentioned water projects fail on these two questions than on any other:
- "Where will the consumables come from in five years?" Chlorine tablets, replacement filter cartridges, and lamps that aren't locally available cause systems to fail gradually. We design around what's locally sourceable.
- "What happens when the power dies?" Grid power in many of our communities is intermittent. We default to gravity-driven and solar-powered systems unless context demands otherwise.
The Turbidity Problem
Surface water in tropical climates is heavily turbid, especially in rainy seasons. Suspended particles shield pathogens from chlorine and UV, and they clog membrane filters. Pre-treatment (settling, coagulation, or coarse filtration) is often required before primary treatment, and is frequently overlooked in turnkey designs sold by Western vendors.
From Reaction to Anticipation
The traditional model of disaster response is reactive. A typhoon makes landfall, infrastructure collapses, water becomes contaminated, disease outbreaks follow within days, and emergency supplies arrive, usually too late, often in the wrong places, sometimes not at all. The cost in lives, money, and recovery time is enormous, and largely avoidable.
Anticipatory action inverts the model. Instead of responding after a disaster, responders use storm forecasts to position water-treatment supplies and bottled water before the disaster strikes, at the specific locations most likely to be cut off, contaminated, or overwhelmed.
Water that reaches a community before a typhoon makes landfall does more good than far larger deliveries three days after. It is the difference between prevention and triage.
Why Water Failures Cascade in Disasters
Storm surge, flooding, and infrastructure damage destroy the conditions that keep drinking water safe:
- Source contamination. Wells, springs, and surface intakes become contaminated by floodwater carrying sewage, agricultural runoff, and chemical pollution.
- Power loss. Treatment plants, pumps, and UV systems fail. Communities revert to raw, untreated water.
- Supply-chain disruption. Chlorine, replacement filters, and other consumables can't be delivered for days or weeks.
- Population displacement. Evacuation centers concentrate people, increasing disease transmission risk if water is inadequate.
Waterborne disease typically emerges within 5–10 days of a major flooding event. Cholera, dysentery, and typhoid all spike. Children, the elderly, and the immunocompromised die first.
What Anticipatory Action Looks Like
- Estimate. Use storm forecasts to estimate which places will lose safe drinking water and where the nearest working supply is.
- Pre-position. Stage water-treatment supplies and bottled water with local partners before infrastructure fails.
- Activate. Coordinate with local government, NGOs, and community health workers to distribute supplies in the first hours after impact, when conventional response chains are still scrambling.
The Anticipatory Action Platform
We are building a free, open-source app for the Philippines that estimates where drinking water will run short after a typhoon or earthquake. It focuses on water refilling stations, the small shops where 46.2% of Philippine households mainly get their drinking water (2020 Census). When a disaster knocks out power, utility water or buildings, many stations stop producing for days to weeks.
How the Platform Works
1. Hazard: Where the Storm or Earthquake Hits
The app follows a live storm track, replays historical typhoons and earthquakes, or lets users draw their own scenario.
2. Impact: Which Stations Go Down
For each area, it estimates which refilling stations are likely to lose power, utility water or their building, and how many people would lose treated drinking water as a result.
3. Supply: Where the Nearest Water Is
It matches each area losing water with nearby stations that are likely still producing, so responders can buy water close by instead of trucking it across the country.
Design Principles
- Free for governments. The platform is provided pro bono to disaster-management agencies. No license fees, no strings.
- Transparent methodology. Every data source and assumption is visible, so decision-makers can question the model rather than trust a black box.
- Built for action, not analysis. Outputs are practical: which stations may go down, how much water is lost, and where the nearest working supply is.
- Built to be tested against history. The app replays past storms; checking its estimates against what actually happened is the next step.
Try the Platform
The platform is in active development for the Philippines. The current build is a working prototype: the data sources are real and the model runs live, but its outputs are uncalibrated estimates, not yet forecasts. Since July 2026 it has focused on one question: which water refilling stations will stop producing drinking water after a typhoon or earthquake, and which nearby stations can keep supplying responders. We are iterating on the user experience. Before anyone uses it operationally, the model still needs to be validated against real events and conversations with station owners.
Anticipatory Action Platform: Live Prototype
Replay past typhoons and earthquakes, follow a live storm, or draw your own storm path, and see which areas the model estimates would lose treated water.
Open the Platform →What You Can Do With It Today
- Live storm mode. Follow an active storm’s published track and see which areas the model estimates could lose treated drinking water.
- Historical mode. Replay 539 real typhoons from 2000–2026, and past earthquakes, and see the estimated station outages and water loss for each.
- Simulation mode. Draw a custom storm path, set wind and rainfall parameters, and see the estimated number of people who lose treated water and the nearest stations likely still producing.
Partner With Us on the Platform
We are looking for two kinds of partners. First, government emergency-management agencies and disaster-response NGOs who would test the platform, starting with a tabletop exercise. Your real-world feedback is what makes the tool useful. Second, technical contributors with relevant expertise: storm physics, vulnerability modeling, geospatial analysis, or front-end engineering. The platform is open development; the more eyes and hands, the better the estimates.