How We Fund This Work
Lake restoration is a long arc — typically five to ten years from first chemistry assessment to recovered ecosystem. The science is well-established, but every lake has a unique combination of watershed inputs, depth profile, sediment chemistry, and community capacity that makes implementation a multi-year iteration rather than a turnkey deployment. The same hundred dollars that delivers a gravity filter to protect a family for a decade could fund the first round of nutrient sampling at a candidate lake — work that won't show measurable results for two years.
Like our heavy-metal remediation work, lake restoration is funded differently from our pathogen and nutrition work. The structure is deliberate.
The Two-Stage Pipeline
Stage 1 — Founder & Volunteer Funded
What it is: nutrient and dissolved-oxygen profiling, sediment chemistry, watershed mapping, partner identification, and small-scale pilot interventions in collaboration with local lake-management associations.
How it's paid for: our founders and volunteer scientists fund this stage out of pocket and through donated expertise. No external donations cover this work.
Why we do it this way: until limnology baseline data and pilot results validate a recovery pathway for a specific lake, the fundraising case doesn't exist yet. We earn the data first; we ask for capital second.
Stage 2 — Grant & Foundation Funded
What it is: watershed best-management-practice (BMP) programs, phosphorus-binding (LMB / Alum) or oxygenation campaigns, multi-year monitoring infrastructure, and partnerships with regional fisheries, tourism, and water authorities.
How it's paid for: $50K–$5M+ commitments from foundations, government agencies, international NGOs, and sustainable-development organizations.
Why this capital source: lake restoration timeframes (three to ten years to recovered productivity) match what foundation and sustainable-development capital is structured to absorb. Multi-decade economic returns for the local community make the case durable.
Why Small Donations Don't Belong Here
If you have a hundred dollars, we don't think you should give it to a lake restoration project that may take years to validate. We think you should give it to a gravity membrane filter that will protect a family from waterborne pathogens for a decade or more. 2.2 billion people without safe drinking water deserve that money first.
Lake restoration, when it works, generates long-term economic returns of 20:1 or higher when fisheries, tourism, and drinking-water benefits are aggregated. Some recovered lakes have repaid their full restoration cost in a single fishing season. But variance is high — some lakes are too far gone to fully recover, and others recover only partially. Time horizons are long. Per-dollar attribution to individual donors is genuinely impossible. Foundations and sustainable-development funders have the time horizons and risk tolerance for that profile of investment; small donors deserve clarity about both the impact and the risk.
Foundations, government agencies, international NGOs, and sustainable-development organizations: if you fund this kind of work, get in touch about a partnership. We have validated lake assessments in several regions ready for the kind of capital you bring.
Individual donors: your contribution makes the most difference in our pathogen and nutrition work, where every dollar goes directly to filters and supplements. See what your support delivers.
This Work Runs on Partners and Expertise
Lake restoration isn't funded by small donations — it's funded by foundations and sustainable-development capital, and delivered by volunteer scientists. If you can bring either, we want to hear from you.
Why Lake Restoration Compounds for Decades
A restored lake doesn't pay back gradually. Communities regain a fishing economy. Tourism returns. Drinking water becomes safer. The math runs to multiples of 20:1 or higher when the full economic recovery is included. This is the case that makes the work attractive to foundation and sustainable-development capital once Stage 1 research has demonstrated viability for a specific lake.
It costs roughly $50–$200 per hectare-year to maintain a healthy lake through upstream watershed management. It costs $5,000+ per hectare-year to replace lost lake productivity through intensive cage-aquaculture infrastructure — and that replacement never restores the tourism, biodiversity, or drinking-water value of the original lake.
Cost Per Hectare-Year of Sustained Productivity
Sources: US EPA Lake Management Reports, North American Lake Management Society, peer-reviewed literature on watershed BMPs and in-lake remediation. Aquaculture replacement excludes biodiversity, tourism, and drinking-water co-benefits that lakes provide and aquaculture does not.
Why Source Control Wins
- Upstream is cheaper than in-lake. A dollar spent on agricultural BMPs, riparian buffer restoration, or wastewater nutrient removal prevents the loading that drives eutrophication. In-lake interventions treat symptoms; source control treats causes.
- Recovery is non-linear. A lake degrades gradually for decades, then crashes within a single bloom season. Recovery, when it comes, often happens just as fast — once internal phosphorus loading is controlled, fish populations can rebound within three to five years.
- Economic returns compound across sectors. Restoring a lake recovers the fishing economy and the tourism economy and the drinking-water value. Few interventions have this kind of three-sector ROI.
- Replacement isn't really replacement. Building aquaculture infrastructure to compensate for a dead lake costs more per kilogram of protein and never restores the biodiversity, recreation, or water-supply functions the original system provided.
For full cost data and decision logic, see Technoeconomic Analysis below.
The Lakes Are Dying
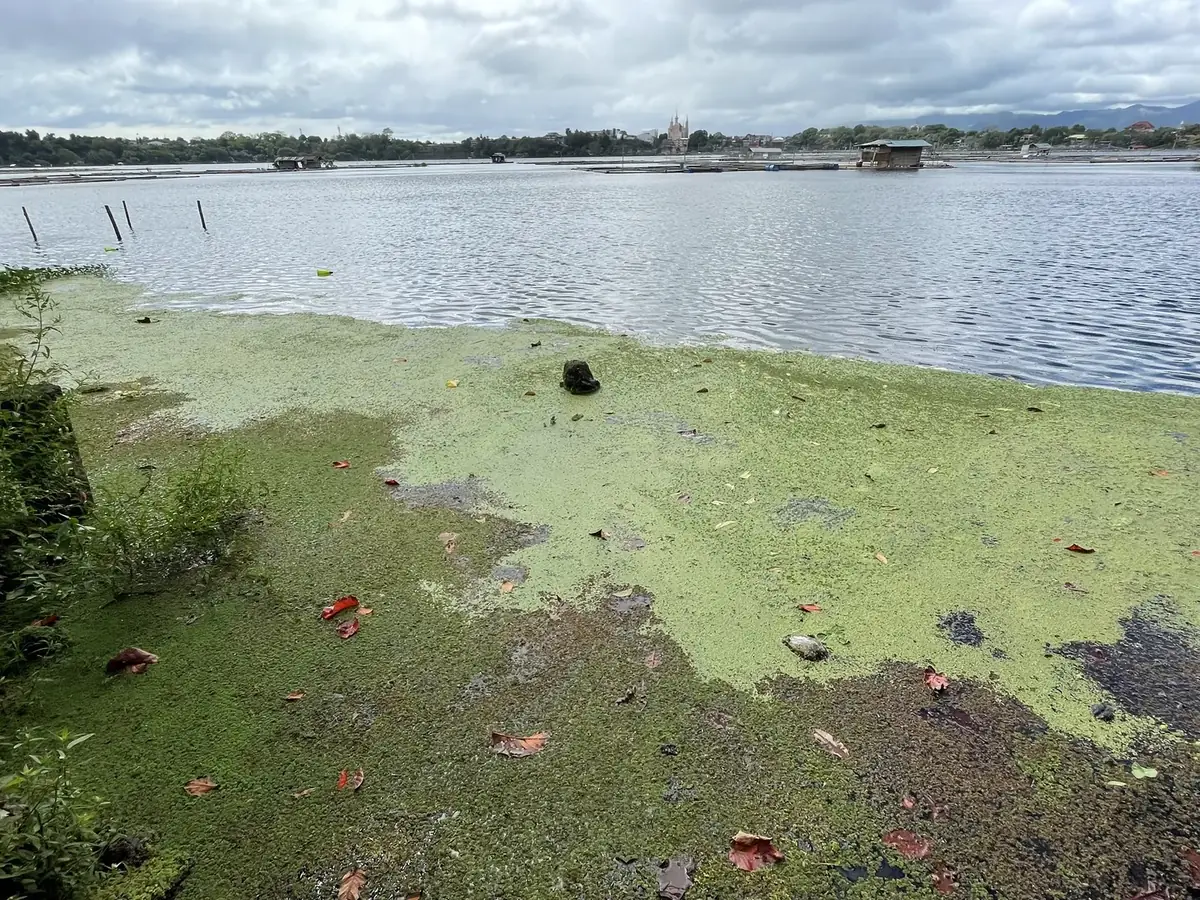
Roughly half of the world's lakes show signs of eutrophication. A growing share have crossed the threshold into hypereutrophic collapse — characterized by chronic cyanobacteria blooms, hypoxic dead zones, and loss of the fish populations that local communities depend on. The damage is preventable. Most of it is reversible. Almost none of it is being addressed at the scale the problem requires.
The Eutrophication Cycle
Eutrophication is a chain reaction triggered by nutrient overload — primarily phosphorus and nitrogen from agricultural runoff, untreated wastewater, and atmospheric deposition:
- Nutrients drive algal growth. Phosphorus is typically the limiting nutrient in freshwater. Add it, and algae multiply rapidly.
- Algae die and decompose. Bacterial decomposition consumes dissolved oxygen, especially in the deeper hypolimnion where the dead biomass settles.
- Hypoxia kills fish. Once dissolved oxygen drops below ~2 mg/L, fish die or flee. Below 1 mg/L, only anaerobic organisms survive.
- Sediment chemistry flips. Anoxic sediments release stored phosphorus back into the water column ("internal loading"), continuing the cycle even after external nutrient inputs stop.
- Cyanobacteria take over. These nitrogen-fixing photosynthesizers thrive in nutrient-rich water and produce toxins (microcystin, anatoxin) that poison fish, livestock, and humans.
The Daily Toll
Depend on Aquatic Protein
Freshwater fish are a primary source of animal protein for hundreds of millions of the world's poorest people
Of World's Lakes
Show measurable signs of eutrophication or hypereutrophic collapse
Annual Value
Global fisheries economic value — most concentrated in the communities that can least afford its loss
The Three-Sector Toll
A failing lake doesn't lose just one thing. It loses three at once, and the losses compound:
- Food. A lake that supported 50,000 fishing days per year stops supporting any. Protein the community depended on must be sourced and paid for elsewhere — usually it isn't, and child malnutrition follows.
- Livelihoods. Fishing-dependent families lose income. Boat builders, net makers, fish smokers, and market vendors lose their customers. The collapse cascades through the local economy within one to three years.
- Tourism. Visitors don't come to lakes covered in toxic scum. Restaurants close. Hotels empty. Cottage rental income vanishes. Property values drop. Regional tax bases shrink. Recovery, if it happens, takes longer than the collapse.
The Hidden Toxic Burden
Even fish that survive the initial collapse carry the contamination forward. Mercury that entered lakes from atmospheric deposition or upstream artisanal mining is methylated by anaerobic bacteria in eutrophic sediments — exactly the conditions eutrophication creates. The result: methylmercury concentrates up the food chain, peaking in the predatory fish that subsistence and recreational fishers most often catch and eat. See our work on mercury source control →
Diagnose the Watershed. Heal the Lake.
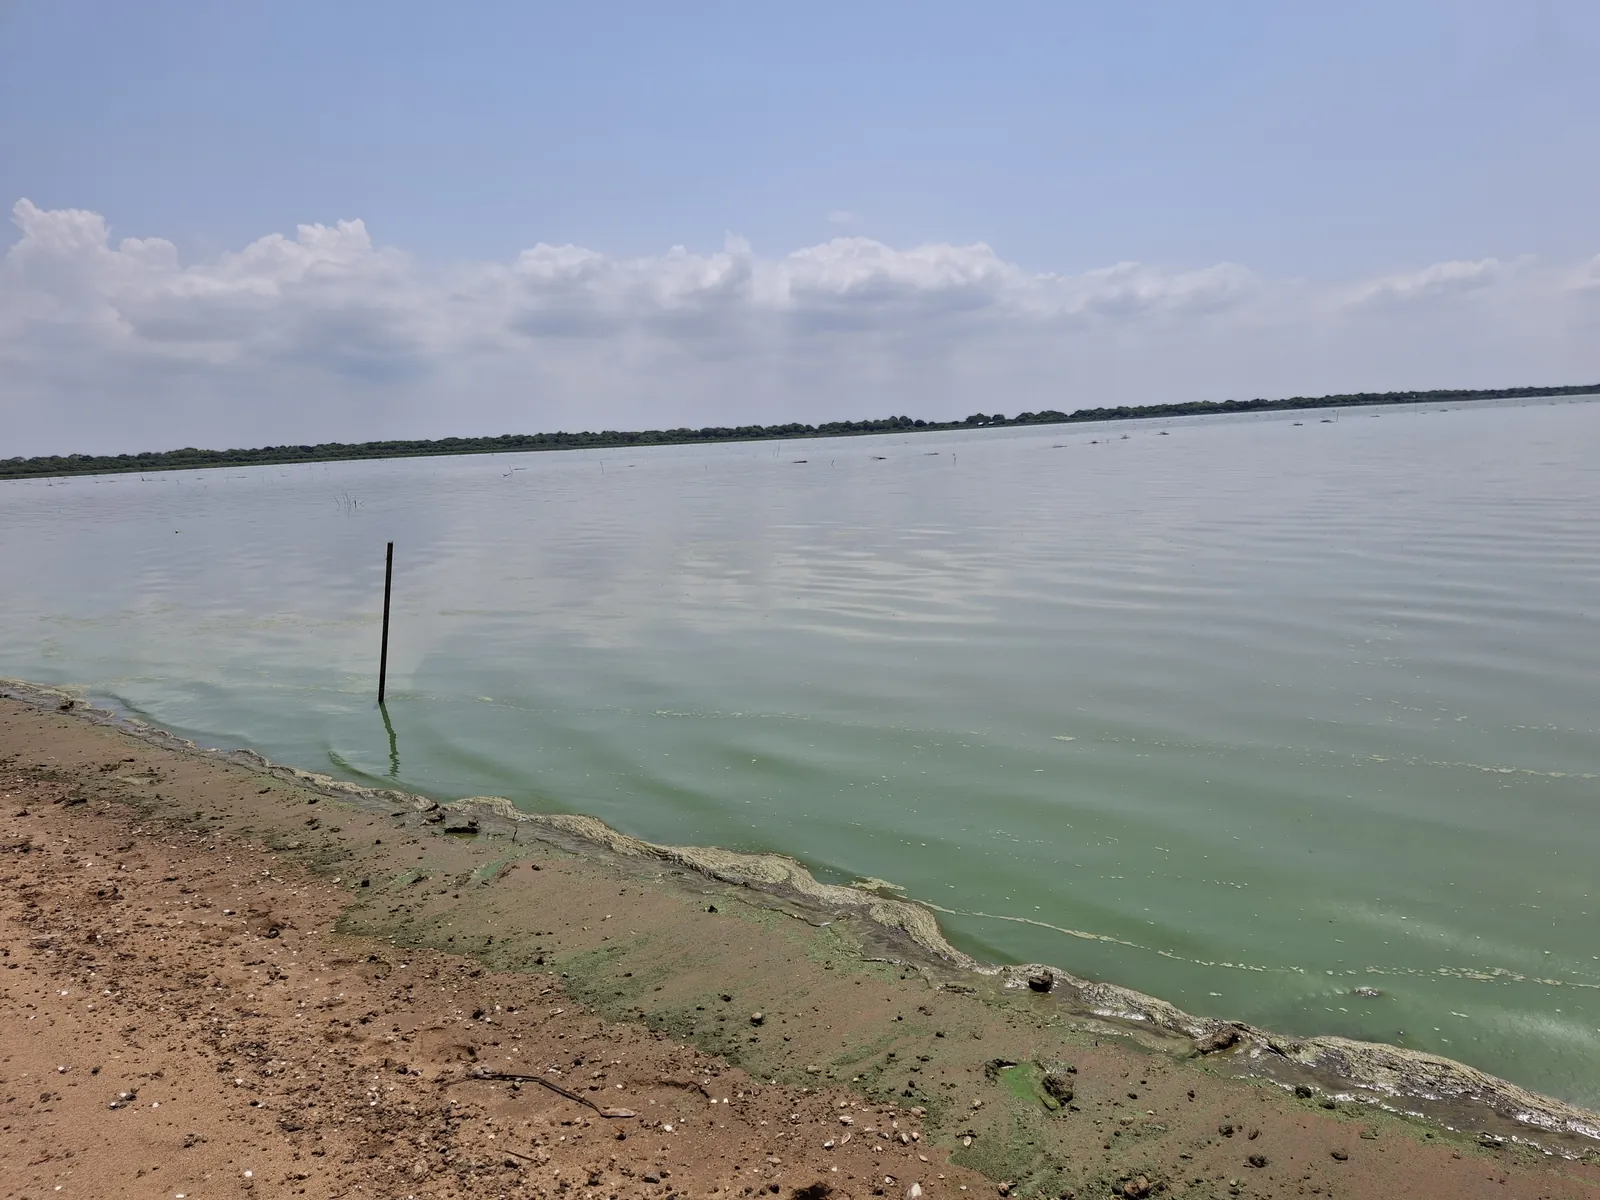
Lake recovery requires both upstream and in-lake work, deployed together. Stop the loading from the watershed; treat the lake to break the internal-loading cycle; rebuild fish populations once the chemistry is right. None of these steps work in isolation.
Watershed · Source Control
Riparian buffers and wetland restoration. Vegetated zones along streams trap sediment-bound phosphorus before it reaches the lake.
Agricultural BMPs. Cover crops, no-till practices, and nutrient-management plans reduce phosphorus runoff at the source.
Wastewater nutrient removal. Where municipal or industrial discharges contribute, working with utilities to install enhanced phosphorus removal eliminates the largest single input.
In-Lake · Internal Loading
Phosphorus binding (Alum and LMB). Two complementary tools. Alum (aluminum sulfate) is low-cost and fast-acting; in experienced hands it is completely safe and holds for decades. Lanthanum Modified Bentonite (LMB) is pH-tolerant and needs no buffering, so it is easier to manage where pH swings. Because they excel in different water chemistries, the "Flock & Lock" combination isn't just additive — the blended floc is denser and caps the sediment better, and it holds phosphorus down across a wider range of conditions than either tool alone.
Oxygenation/Aeration. Keeping the water above the sediment oxygenated holds iron in its oxidized form, which keeps phosphorus locked in the sediment instead of releasing it. It works in both stratified and fully mixing (polymictic) lakes — the requirements are a constant oxygen supply and iron-rich sediment (or, less commonly, iron injection) for the phosphorus to bind to.
Peroxide Algaecides. Targeted interventions with hydrogen peroxide can selectively kill cyanobacteria without harming fish or depleting the dissolved oxygen in the water.
The Diagnose / Design / Deploy Loop
- Diagnose. Vertical profiles of temperature, dissolved oxygen, conductivity, and pH. Water-column nutrient panels (total phosphorus, nitrate, ammonia, silica). Sediment phosphorus fractionation. Watershed nutrient flux modeling. Cyanobacteria community composition.
- Design. Match interventions to the lake's loading profile (external vs. internal dominance), thermal regime (stratified vs. polymictic), and community capacity (full-time operator vs. seasonal volunteer maintenance).
- Deploy. Through local lake-management associations, regional fisheries authorities, and partner sustainable-development organizations. We provide the science and remote technical support; they own the operations.
The cheapest and most durable lake restorations start from the watershed and work inward. The most expensive and least durable start in the lake and never address what's loading it. We see the pattern often enough that we structure every assessment to test source-control viability before recommending in-lake interventions.
Treatment Technologies
The technologies below are deployed depending on the loading profile, depth structure, and community capacity. Choice is always context-specific. Most successful restorations combine source-control and in-lake interventions in sequence.
Source Control — Watershed Interventions
Riparian Buffers and Constructed Wetlands
Mechanism: vegetated zones (trees, grasses, wetland plants) along stream corridors and lake margins intercept overland runoff. Plants take up dissolved nutrients; sediment-bound phosphorus is physically trapped by stems and root mats.
Trade-offs: highly cost-effective per kilogram of phosphorus retained ($5–$50/kg-P). Requires land-use cooperation with riparian landowners. Performance varies seasonally.
Agricultural Best Management Practices
Mechanism: cover crops keep soil planted year-round, preventing winter erosion. No-till farming eliminates the soil disturbance that mobilizes phosphorus. Nutrient-management plans match fertilizer application to crop demand, reducing surplus.
Trade-offs: requires producer engagement, often through cost-share programs with regional agricultural extension. Reductions of 20–60% in phosphorus loading are typical when adopted at watershed scale.
Wastewater Phosphorus Removal Upgrades
Mechanism: chemical precipitation (ferric chloride or alum dosing) at municipal or industrial wastewater plants removes phosphorus before discharge. Enhanced biological phosphorus removal (EBPR) is also widely used at larger scale.
Trade-offs: the highest per-kg phosphorus removal cost but the most reliable and concentrated lever where a point source dominates the watershed budget.
In-Lake — Internal Loading Interventions
Lanthanum Modified Bentonite (LMB)
Mechanism: LMB (commercially known as Phoslock and similar products) is a bentonite clay matrix loaded with lanthanum ions. Applied as a slurry to the lake surface, it sinks through the water column and settles as a thin layer on the sediment. The lanthanum binds dissolved orthophosphate to form rhabdophane (LaPO₄·nH₂O), an extremely stable mineral that does not re-release phosphorus across a wide pH range or under anoxic sediment conditions.
Trade-offs: higher capital cost than alum ($1,000–$3,000 per hectare), but no pH adjustment or buffering required and no fish-toxicity risk during application. Because it holds phosphorus across a wide pH range, it is the easier tool to manage in lakes where pH is variable.
Alum Treatment (Aluminum Sulfate)
Mechanism: alum is dosed across the lake surface from a barge. Aluminum hydroxide flocs form, scavenge dissolved phosphorus, and settle to the sediment surface where they create a barrier to internal phosphorus release.
Trade-offs: lower capital cost than LMB ($500–$1,500 per hectare) and well-documented multi-decade durability in well-buffered lakes. Alum is completely safe and effective when applied by professionals who understand the lake's chemistry — it holds best within pH 6–8 and needs careful pH management during application to keep dissolved aluminum from becoming toxic to fish. The caution is about expertise, not the chemical: it is not a tool for operators unfamiliar with lake chemistry.
"Flock & Lock" — Combined Application
Mechanism: alum and LMB are applied together, or in close sequence. The combined floc is of medium density — heavier and more cohesive than either alone — so it settles into a better sediment cap. More importantly, because the two binders hold phosphorus under different water chemistries, the combination keeps phosphorus locked down across a wider range of pH and redox conditions than either tool by itself.
Trade-offs: highest capital cost of the three approaches, but the most robust outcome. Fisheries often have highly dynamic water chemistry, and the combination is a safety net — it protects the treatment from failing if conditions shift, where a single binder tuned to one chemistry might not.
Oxygenation/Aeration
Mechanism: compressed air or pure oxygen is delivered to the water overlying the sediment. Maintaining dissolved oxygen above ~2 mg/L at the sediment-water interface keeps iron in its oxidized form, which binds phosphorus instead of releasing it. This works whether the lake is thermally stratified or fully mixing (polymictic) — the mechanism is about keeping the sediment surface oxic, not about the lake's stratification. Iron injection supplementation — adding ferric chloride or ferric sulfate alongside oxygenation — increases the pool of oxidized iron available at the sediment interface, but it is uncommon in practice because it is complex to manage.
Trade-offs: moderate capital cost ($30K–$300K depending on lake size), and it requires a constant oxygen supply — the ongoing energy cost is often the deciding factor. It only suppresses phosphorus release where the sediment is iron-rich; in iron-poor sediments it needs iron injection to work, which is uncommon and complex to run. Where those conditions are met, it is very effective.
Peroxide Algaecides
Mechanism: targeted interventions for bloom-prone systems, ideally at the start of the bloom. Hydrogen peroxide preferentially damage cyanobacteria over beneficial algae that fish eat such as green algae and diatoms.
Trade-offs: treats symptoms not causes. Best as a bridge while source control and internal-loading interventions take effect. Per-hectare cost varies by approach and results only last a few weeks in most cases.
Carrying Capacity Restoration
Mechanism: once water chemistry recovers, fish populations rebuild — but slowly without help. Selective restocking, habitat improvements (woody debris, spawning beds), and fishing-pressure management accelerate recovery to community-supporting productivity.
Trade-offs: attempting this before chemistry recovery wastes the fish. Order matters: chemistry first, biology second.
Free Monitoring Tools for Lake Managers
Through our partnership with LakeTech, communities, lake associations, and government agencies can access free water-quality monitoring tools, baseline assessments, and intervention planning resources — no license fees, no ongoing cost.
Open LakeTech →Technoeconomic Analysis
Full cost data, decision logic, and methodology behind our lake-restoration interventions. This is the section to read if you are evaluating us as a technical partner, comparing remediation strategies for a foundation grant program, or trying to understand exactly how the cost-effectiveness numbers in the Cost-Benefit Summary section are derived.
Intervention Cost Comparison
| Intervention | Scale | Capital Cost | Lifespan | Annual $/Hectare | Key Trade-offs |
|---|---|---|---|---|---|
| Riparian buffer restoration | Watershed | $2K – $20K | 20+ years | $30 – $150 | High leverage; needs landowner cooperation |
| Agricultural BMPs | Watershed | $5K – $50K | Ongoing | $50 – $200 | Watershed-scale impact; producer engagement required |
| Wastewater P removal | Point source | $50K – $5M | 20+ years | $80 – $400 | Reliable concentration; capital intensive |
| Lanthanum Modified Bentonite (LMB) | Whole lake | $1K – $3K/ha | 15+ years | $400 – $1,500 | pH-tolerant; no fish toxicity; easier to apply |
| Alum treatment | Whole lake | $500 – $1.5K/ha | 10–20 years | $200 – $800 | Lower cost; fast-acting; needs expert pH management |
| "Flock & Lock" (Alum + LMB) | Whole lake | $1.5K – $4K/ha | 15+ years | $500 – $1,800 | Synergistic; recommended for hypereutrophic systems |
| Oxygenation/aeration | Whole lake | $30K – $300K | 15+ years | $400 – $1,500 | Very effective with iron-rich sediment and a constant oxygen supply; works in stratified and polymictic lakes |
| Peroxide Algaecides | Whole lake | None | 2 – 4 weeks | $300 – $1,200 | Symptom treatment; bridge during recovery |
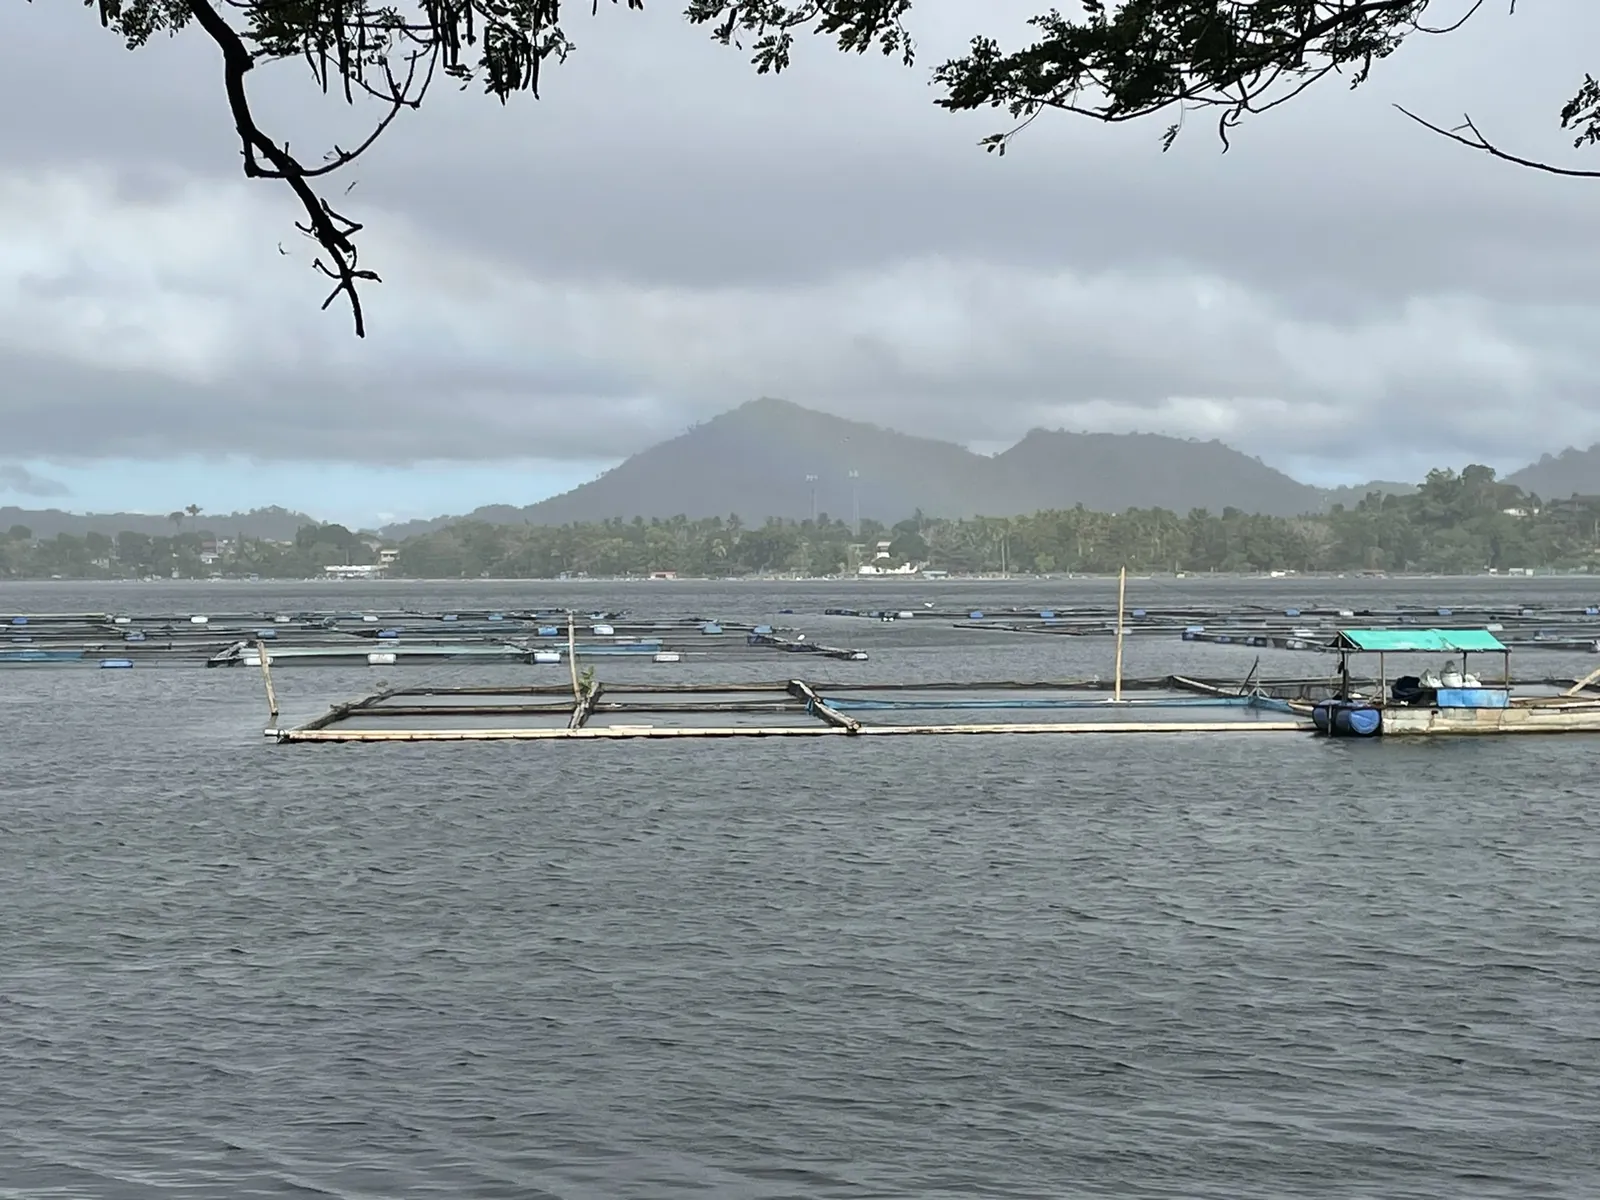
| Aquaculture replacement | Off-lake | $100K – $1M+ | 10–25 years | $5,000+ | Replaces protein only; loses tourism, biodiversity, water |
Annual costs reflect mid-range estimates from peer-reviewed literature and lake-management practice. Actual costs vary substantially with lake size, depth, loading severity, and regional labor and supply costs.
Decision Logic: Matching Intervention to Lake
| Lake Profile | Primary Intervention | Rationale |
|---|---|---|
| External loading dominant, agricultural watershed | Riparian buffers + agricultural BMPs | Cheapest leverage on largest source; long-term durability |
| External loading dominant, point source | Wastewater P removal upgrade | Concentration of effort at the single largest input |
| Internal loading dominant, deep stratified | Phosphorus binding (alum, LMB, or both) OR oxygenation/aeration (± iron) | Both interrupt internal loading; choice depends on lake size, water chemistry, and operator capacity |
| Shallow polymictic, recurring blooms | Flock & Lock (alum + LMB) + Peroxide Algaecides | Combined phosphorus binding plus bloom suppression bridges to source control; oxygenation is also viable where the sediment is iron-rich and a constant oxygen supply is affordable |
| Recovered chemistry, depleted fish stock | Carrying capacity restoration + restocking | Biology recovery follows chemistry recovery |
| Hypereutrophic with collapsed economy | All of the above, sequenced over 5–10 years | Multi-stage, multi-funder program; foundation/sustainable-dev capital required |
The Chemistry, in Detail
Lanthanum Modified Bentonite (LMB): pH-Tolerant Binding
LMB is bentonite clay loaded with lanthanum ions. When applied to a lake, it sinks through the water column and settles on the sediment, where lanthanum reacts with dissolved orthophosphate to form rhabdophane (LaPO₄·nH₂O) — an extremely stable mineral. What makes LMB easy to manage is its chemistry: rhabdophane forms across a wide pH range (roughly 4 to 11), needs no buffering, does not re-release phosphorus under anoxic conditions, and carries no fish-toxicity risk during application. Lanthanum's affinity for orthophosphate is also an order of magnitude higher than aluminum's, which means lower dosing for equivalent phosphorus removal — and the lanthanum itself poses no toxicity concern at application rates. The bentonite carrier is critical — it ensures the lanthanum sinks promptly to the sediment rather than dispersing in the water column. The trade-off is cost: lanthanum is more expensive per kilogram than aluminum, and the manufactured composite carries a price premium. LMB is the tool of choice where pH is variable or fish are sensitive and buffering the water is impractical.
Alum: Low-Cost, Fast, Safe in Expert Hands
When aluminum sulfate (Al₂(SO₄)₃) is dosed into water, it hydrolyzes to form aluminum hydroxide (Al(OH)₃) flocs. These flocs scavenge dissolved phosphorus through inner-sphere ligand exchange, settle to the sediment surface, and form a barrier that intercepts phosphorus released from deeper sediments. In well-buffered lakes within pH 6–8, alum treatments hold for 10–20 years and cost a fraction of LMB. Alum's one real constraint is pH: below about 6, dissolved aluminum can become toxic to fish and the floc barrier weakens; above about 8, the floc loses phosphorus-binding capacity. In experienced hands this is entirely manageable — professionals who understand the lake's chemistry dose it safely and reliably. The caution is about the operator, not the chemical: alum should not be applied by people unfamiliar with lake chemistry.
Why "Flock & Lock" Combines Their Strengths
Alum and LMB bind phosphorus through different chemistry, and each performs best under different water conditions — alum in well-buffered, near-neutral water; LMB across a much wider pH and redox range. Applying them together does two things. First, the combined floc is of medium density — heavier and more cohesive than either binder alone — so it settles into a better, more durable sediment cap. Second, because the two binders hold phosphorus under different chemistries, the combination keeps phosphorus locked down across a wider envelope of conditions than either tool by itself. Fisheries often have highly dynamic water chemistry — pH, temperature, and redox can all swing seasonally — so pairing the two is a safety net: if conditions move outside one binder's comfort zone, the other still holds. The combined cost is higher than either alone, but for hypereutrophic lakes and for any system where the chemistry is variable, that resilience is worth it.
Why Oxygenation/Aeration Works (and How Iron Injection Enhances It)
The phosphorus in lake sediments exists primarily bound to iron oxides — specifically ferric (Fe³⁺) hydroxides. As long as the water just above the sediment remains oxic (DO > 2 mg/L), iron stays oxidized and phosphorus stays bound. When that water goes anoxic — classically in the deep layer of a stratified lake during summer, but also at the bed of a polymictic lake during warm, calm spells — iron is reduced to soluble Fe²⁺ and releases the phosphorus it was holding, which later mixing spreads through the lake to fuel the next bloom. Oxygenation breaks this cycle by keeping the sediment surface oxic, and it does so in both stratified and polymictic systems. Two conditions govern whether it actually works: there must be a constant oxygen supply — the ongoing energy cost is usually the deciding factor — and the sediment must be iron-rich enough to hold the phosphorus that stays put. Iron injection — adding ferric chloride or ferric sulfate — can supply that iron where the sediment is depleted, but it is uncommon in practice because it is complex to manage. In iron-limited systems, supplementation can extend effective phosphorus binding by 30–50%.
Why External Source Control Eventually Wins
In-lake interventions buy time. They do not buy permanence. As long as the watershed continues to deliver excess phosphorus, the lake's internal loading will eventually re-establish even after phosphorus binding or oxygenation. The most durable restorations — those that survive a generation rather than a decade — are the ones that pair an in-lake intervention with watershed-scale source control. Riparian buffers, agricultural BMPs, and wastewater upgrades change the mass balance permanently. The in-lake work then becomes a one-time reset rather than a perpetual maintenance cost.